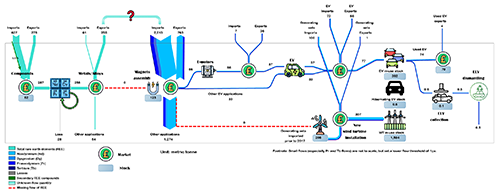
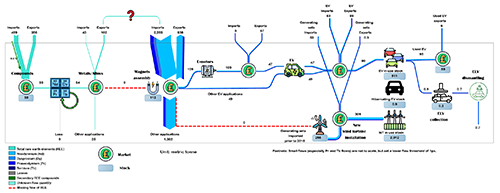
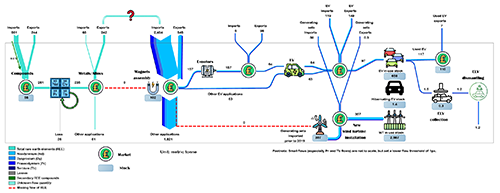
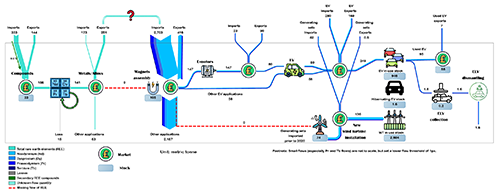
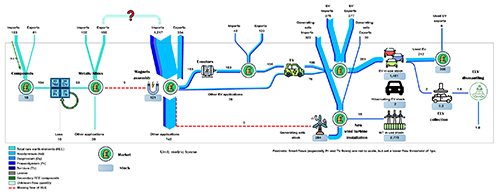
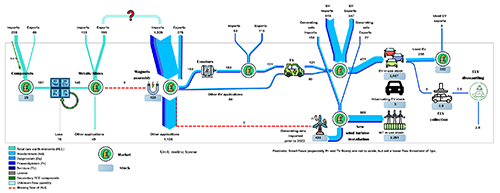
Developing a future circular economy for rare earth element (REE)-bearing products requires a detailed understanding of flows and stocks of REE at both global and national scales.
Previous work on stocks and flows modelling has focused on the role of China, but the REE and REE-bearing products flows in the UK economy are poorly understood. Existing studies have typically tracked the neodymium (Nd) flows, while less attention has been given to dysprosium (Dy), praseodymium (Pr) and terbium (Tb). Analysis of the intermediate component stage (for example, traction motors or wind turbine generators) has also historically been excluded. However, a new paper (Mapping the flows and stocks of permanent magnets rare earth elements for powering a circular economy in the UK) published under the Met4Tech project explores the first UK model based on material flow analysis (MFA) and addresses the following questions:
- what are the flows and stocks of REE in electric vehicles (EVs) and wind turbines in the UK, which may enable the development of a circular economy?
- what are the data qualities and gaps across the UK value chain?
The UK has one of only three major refining plants located outside China and so has an active role in the global REE value chain. The model contributes towards new robust data, information and tracking of REE flows and stocks, using the UK as a case study. The UK model provides:
- the first material flow analysis model to track the REE used in permanent magnets in EVs and wind turbines in the UK (Figures 1 to 6)
- new data that tracks all four key permanent magnet REEs: Nd, Dy, PR and Tb
- detailed analysis of the whole value chain, including the motor and generator components stage
Data
No single UK public data source provides the required information to build a material flow model, so multiple datasets and various assumptions and estimations were required to enable the quantification of REE flows. Assumptions were validated through a series of stakeholder conversations. Datasets that were used for the model can be accessed through the metadata catalogue.
REE flows are calculated from the amount of the trade, production, consumption, in-use stocks and waste (kilograms; number of items) multiplied by the Nd, Dy, Pr and Tb content (%) (Table 1) or material intensities (kg/unit; kg/MW) (tables 2 and 3).
| NdFeB PM REE element | Average percentage (%) |
|---|---|
| Nd | 25.13 |
| Dy | 4.41 |
| Pr | 4.95 |
| Tb | 0.80 |
| Electric traction motors REE element | Average gram per motor (g/motor) |
|---|---|
| Nd | 360 |
| Dy | 115 |
| Pr | 110 |
| Tb | 15 |
| EV type | REE element | Average gram per EV (g/EV) |
|---|---|---|
| HEV | Nd | 569.04 |
| HEV | Dy | 102.31 |
| HEV | Pr | 100.73 |
| HEV | Tb | 10.05 |
| PHEV | Nd | 886.47 |
| PHEV | Dy | 126.66 |
| PHEV | Pr | 38.17 |
| PHEV | Tb | 13.62 |
| BEV | Nd | 765.45 |
| BEV | Dy | 183.73 |
| BEV | Pr | 77.90 |
| BEV | Tb | 26.93 |
Uncertainty analysis
Data availability to quantify material flows is often limited, owing to issues with data scarcity, data aggregation and underreporting. The input data for material flow analysis is therefore considered inherently uncertain. Uncertainty analysis was carried out in this model to allow for a data quality assessment.
The analysis characterises the quality of input data from 1 (good) to 4 (poor), based on five indicators:
- source reliability
- completeness
- temporal correlation
- geographical correlation
- other correlations
While most of the flows have low uncertainty, for example where the data was from official statistics or peer-reviewed papers, high uncertainties were recorded for two flows relating to neodymium-iron-boron permanent magnets. This is due to significant data gaps, which affect the measurement of the individual REE (Nd; Dy; Pr; Tb) flows in these stages.
Results
The results of the study reveal that the UK is a net importer (1238 t of REEs in REE compounds and 7787 t of REEs in permanent magnets between 2017 and 2021) and has a highly fragmented value chain, with a significant amount of REEs in stocks. The potential for this in-use stock to serve as feedstock for REEs and REE-bearing products in the future is substantial, if reverse value chains are developed in time. However, there is currently no recovery of REEs or permanent magnets from these products at end-of-life and REEs are lost during the waste management process.
The development of REE reverse value chains involves the management of end-of-life products, dismantling and recycling, and then re-integrating the products and materials in the value chain. This is currently in development in the UK, which will act as an enabler of the circular economy. Permanent magnet recyclers HyProMag and Ionic Technologies are in the process of scaling up capacity, while the Pensana refinery has the potential to utilise feedstock from secondary sources alongside primary material streams.
Recommendations for value capture from REE flows in the UK
Our recommendations on how to capture economic value from REE flows and stocks that would contribute towards the development of a circular economy in the UK are outlined in Table 4.
| Recommendation | Details |
|---|---|
| Collection and reverse logistics infrastructure |
|
| Product sorting and inspection |
|
| Management of components for repair and refurbishment operations |
|
| REE recycling and recovery |
|
| Collaboration and partnerships |
|
More information
References
Ballinger, B, Stringer, M, Schmeda-Lopez, D R, Kefford, B, Parkinson, B, Greig, C, and Smart, S. 2019. The vulnerability of electric vehicle deployment to critical mineral supply. Applied Energy, Vol. 255, 113844. DOI: https://doi.org/10.1016/j.apenergy.2019.113844
Hsu, W T, Petavratzi, E, Zils, M, Einarsson, S, Morasae, E K, Lysaght, O, and Hopkinson, P. 2024. Mapping the flows and stocks of permanent magnets rare earth elements for powering a circular economy in the UK. Sustainable Production and Consumption, Vol. 47, 37–46. DOI: https://doi.org/10.1016/j.spc.2024.03.027
Hsu, W T, Petavratzi, E, Zils, M, Einarsson, S, Morasae, E K, Lysaght, O, and Hopkinson, P. 2024. Mapping the flows and stocks of permanent magnet rare earth elements for powering a circular economy in the UK supporting information (xlsx).
